SalChartQA
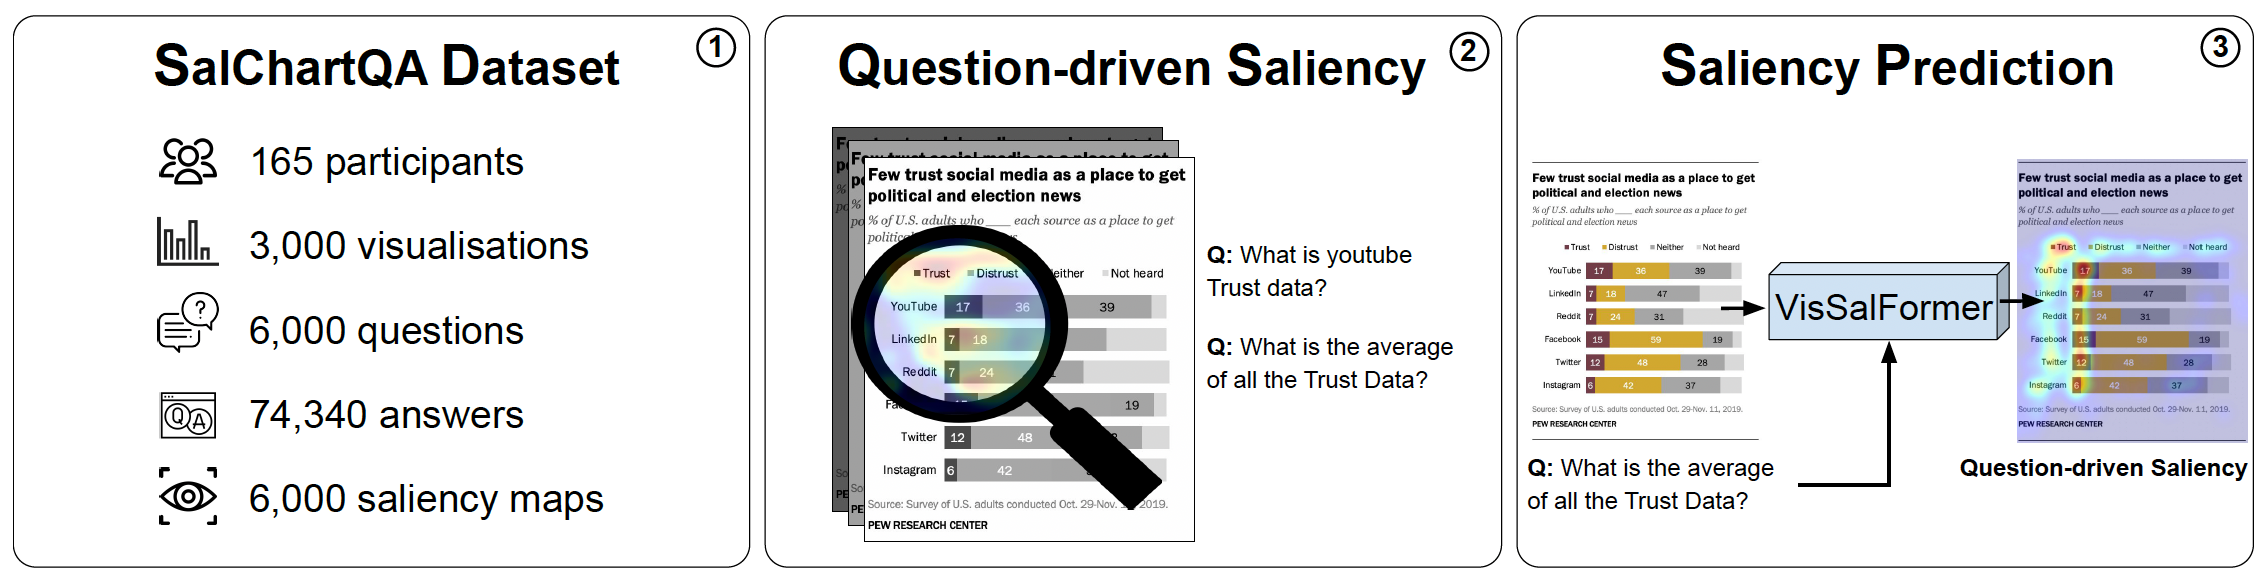
We present SalChartQA -- a novel crowd-sourced dataset that uses the BubbleView interface as a proxy for human gaze and a question-answering (QA) paradigm to induce different information needs in users. SalChartQA contains 74,340 answers to 6,000 questions on 3,000 visualisations.
Informed by our analyses demonstrating the tight correlation between the question and visual saliency, we propose the first computational method to predict question-driven saliency on information visualisations. Our method outperforms state-of-the-art saliency models, improving several metrics, such as the correlation coefficient and the Kullback-Leibler divergence. These results show the importance of information needs for shaping attention behaviour and paving the way for new applications, such as task-driven optimisation of visualisations or explainable AI in chart question-answering. The files of this dataset are documented in README.md.
The full dataset can be downloaded at: https://darus.uni-stuttgart.de/dataset.xhtml?persistentId=doi:10.18419/darus-3884.
The data is only to be used for non-commercial scientific purposes. If you use this dataset in a scientific publication, please cite the following paper:
